28 hour zero baseline test results
As a follow up to the earlier post on our preliminary zero baseline testing, we've now completed a 28 hour test run. This comprised of nearly 100,000 simulated events, with the arrival times measured on two identical Arduino DUE/GPS receiver setups running our code.
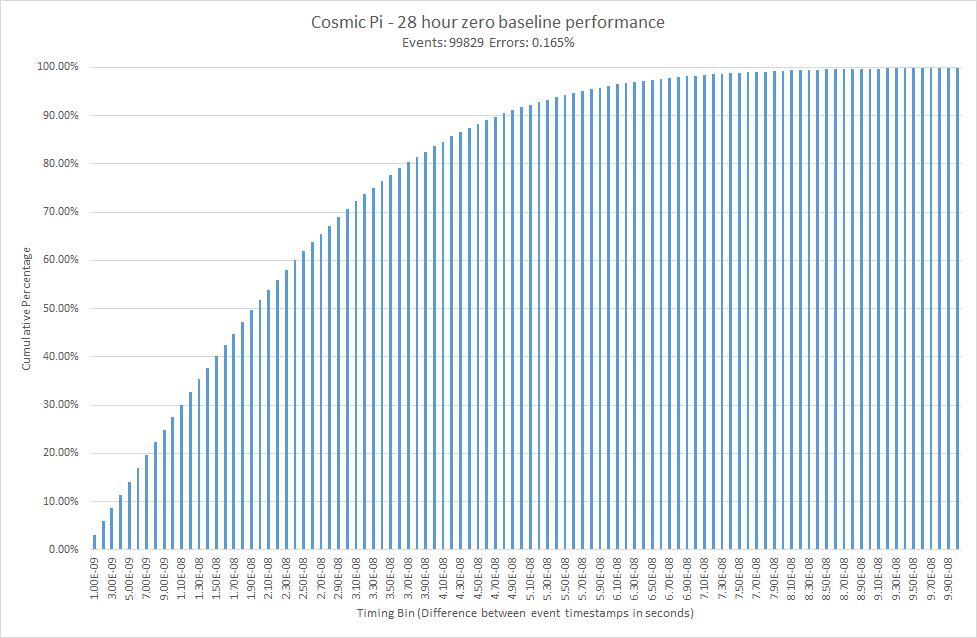
Arrival timestamp variance
The results show that more than 90% of events were within 50ns between the two units. We will do some more detailed statistical analysis on this in the future to bound the arrival time and come up with a 'reasonable' figure for the overall timing accuracy, but at this stage in development the results are very encouraging. There is still more work to do, as we had an error rate of 0.165% - events which were either spurious (i.e. not originating from the signal source), severely miss-timed (no agreement to 10 significant digits of the timestamp) or missed by one of the detectors. We'll be looking at the causes of this in the next few days and weeks, however we think that the spurious events are due to electrical noise coming from the fact that we're still using a breadboard.
You can have a look at our raw data and analysis here. If you have any comments, observations or suggestions please share them with us, either in the comments section or on our facebook page.
Update:
Our community member Philipp Foedisch sent us through a more beautiful histogram, posted here for everyone to enjoy. It shows the distribution of timing records (as opposed to the Root Mean Squared which we used in our initial plot) - the result is a pleasing normal distribution, with a standard deviation of 28.76 ns. The histogram was generated by Philipp using a Matlab script which we've put on the OHWR for everyone, if you fancy using it as a basis for your own analysis. Thank you very much Philipp!
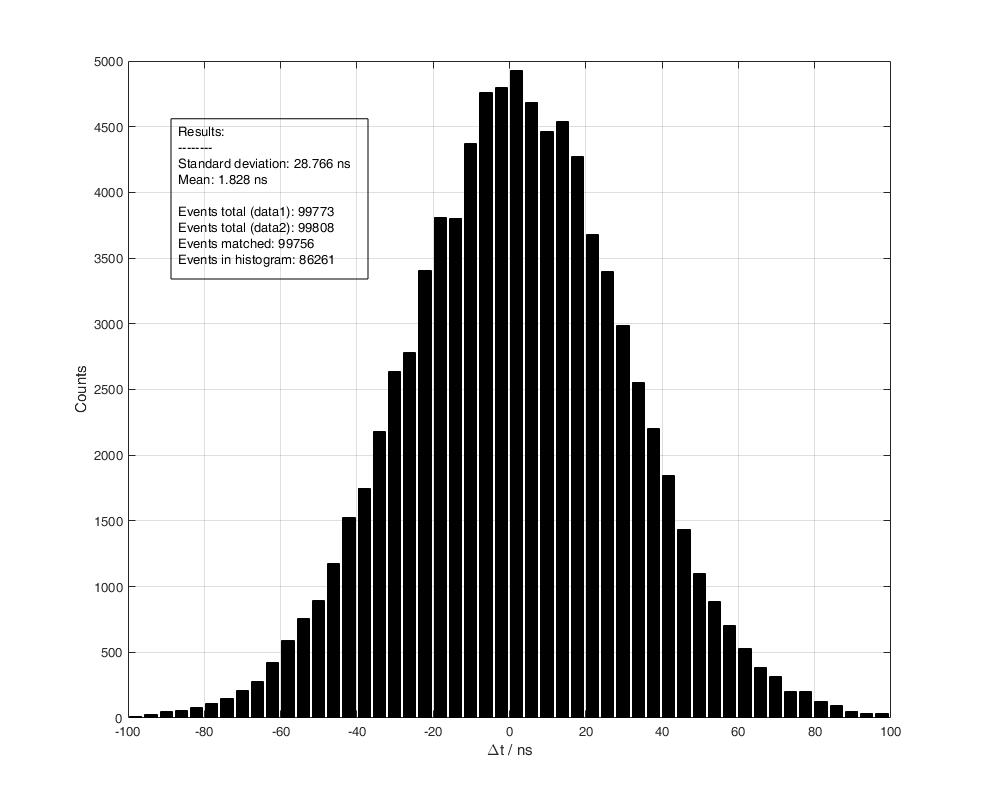
Histogram for 28 hour Zero Baseline